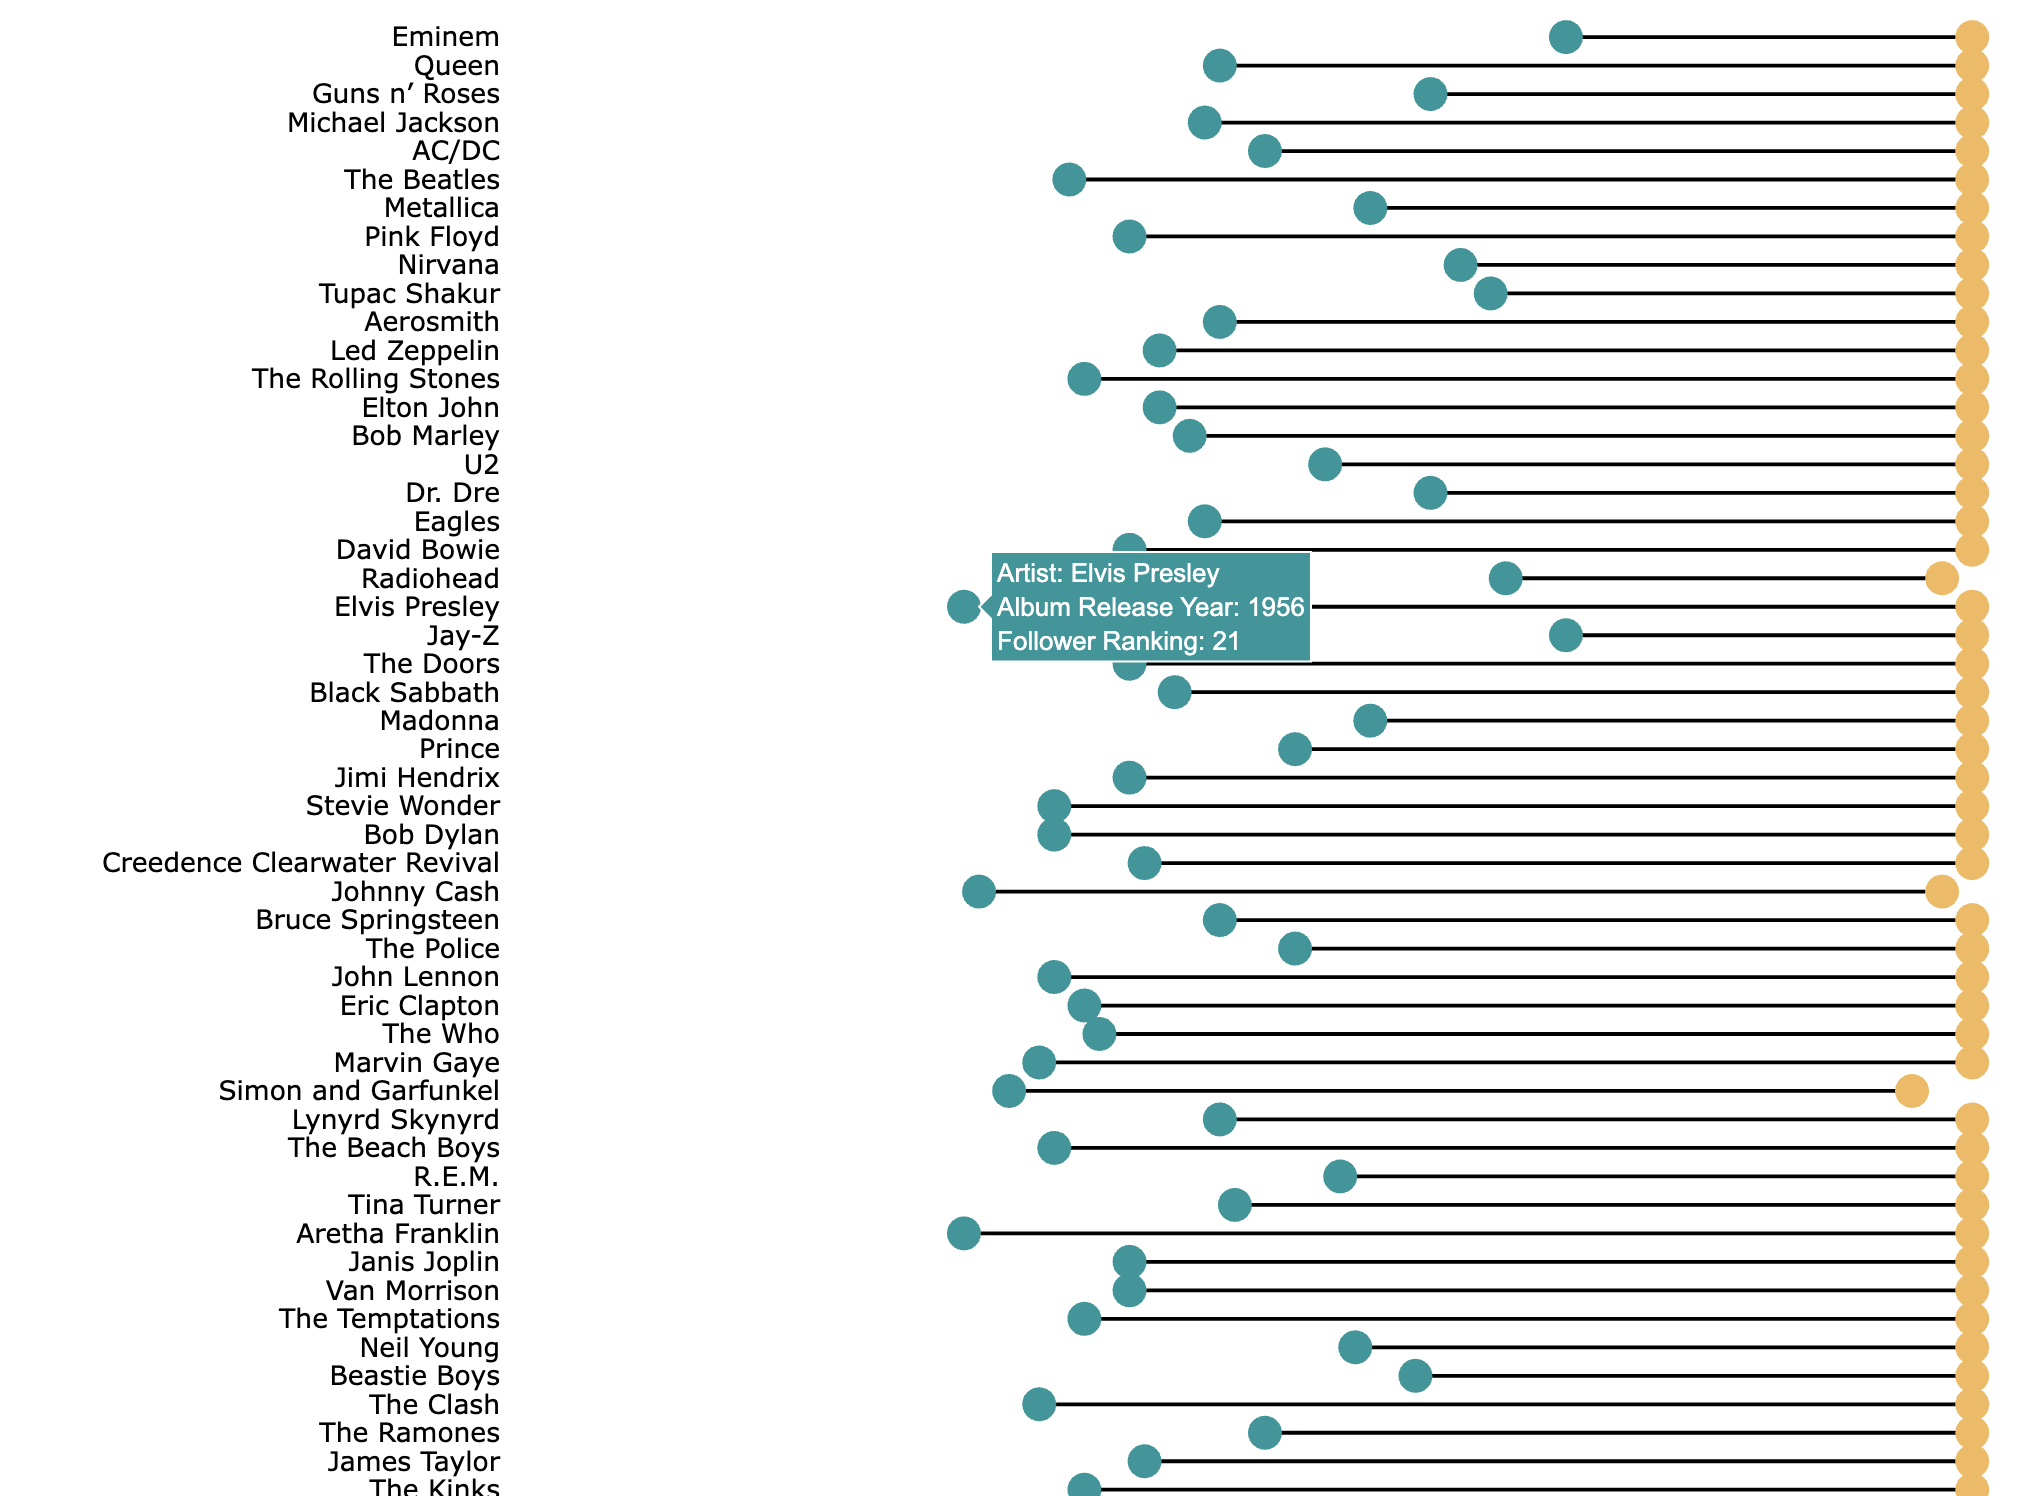
[Jittered plot]: D3.js
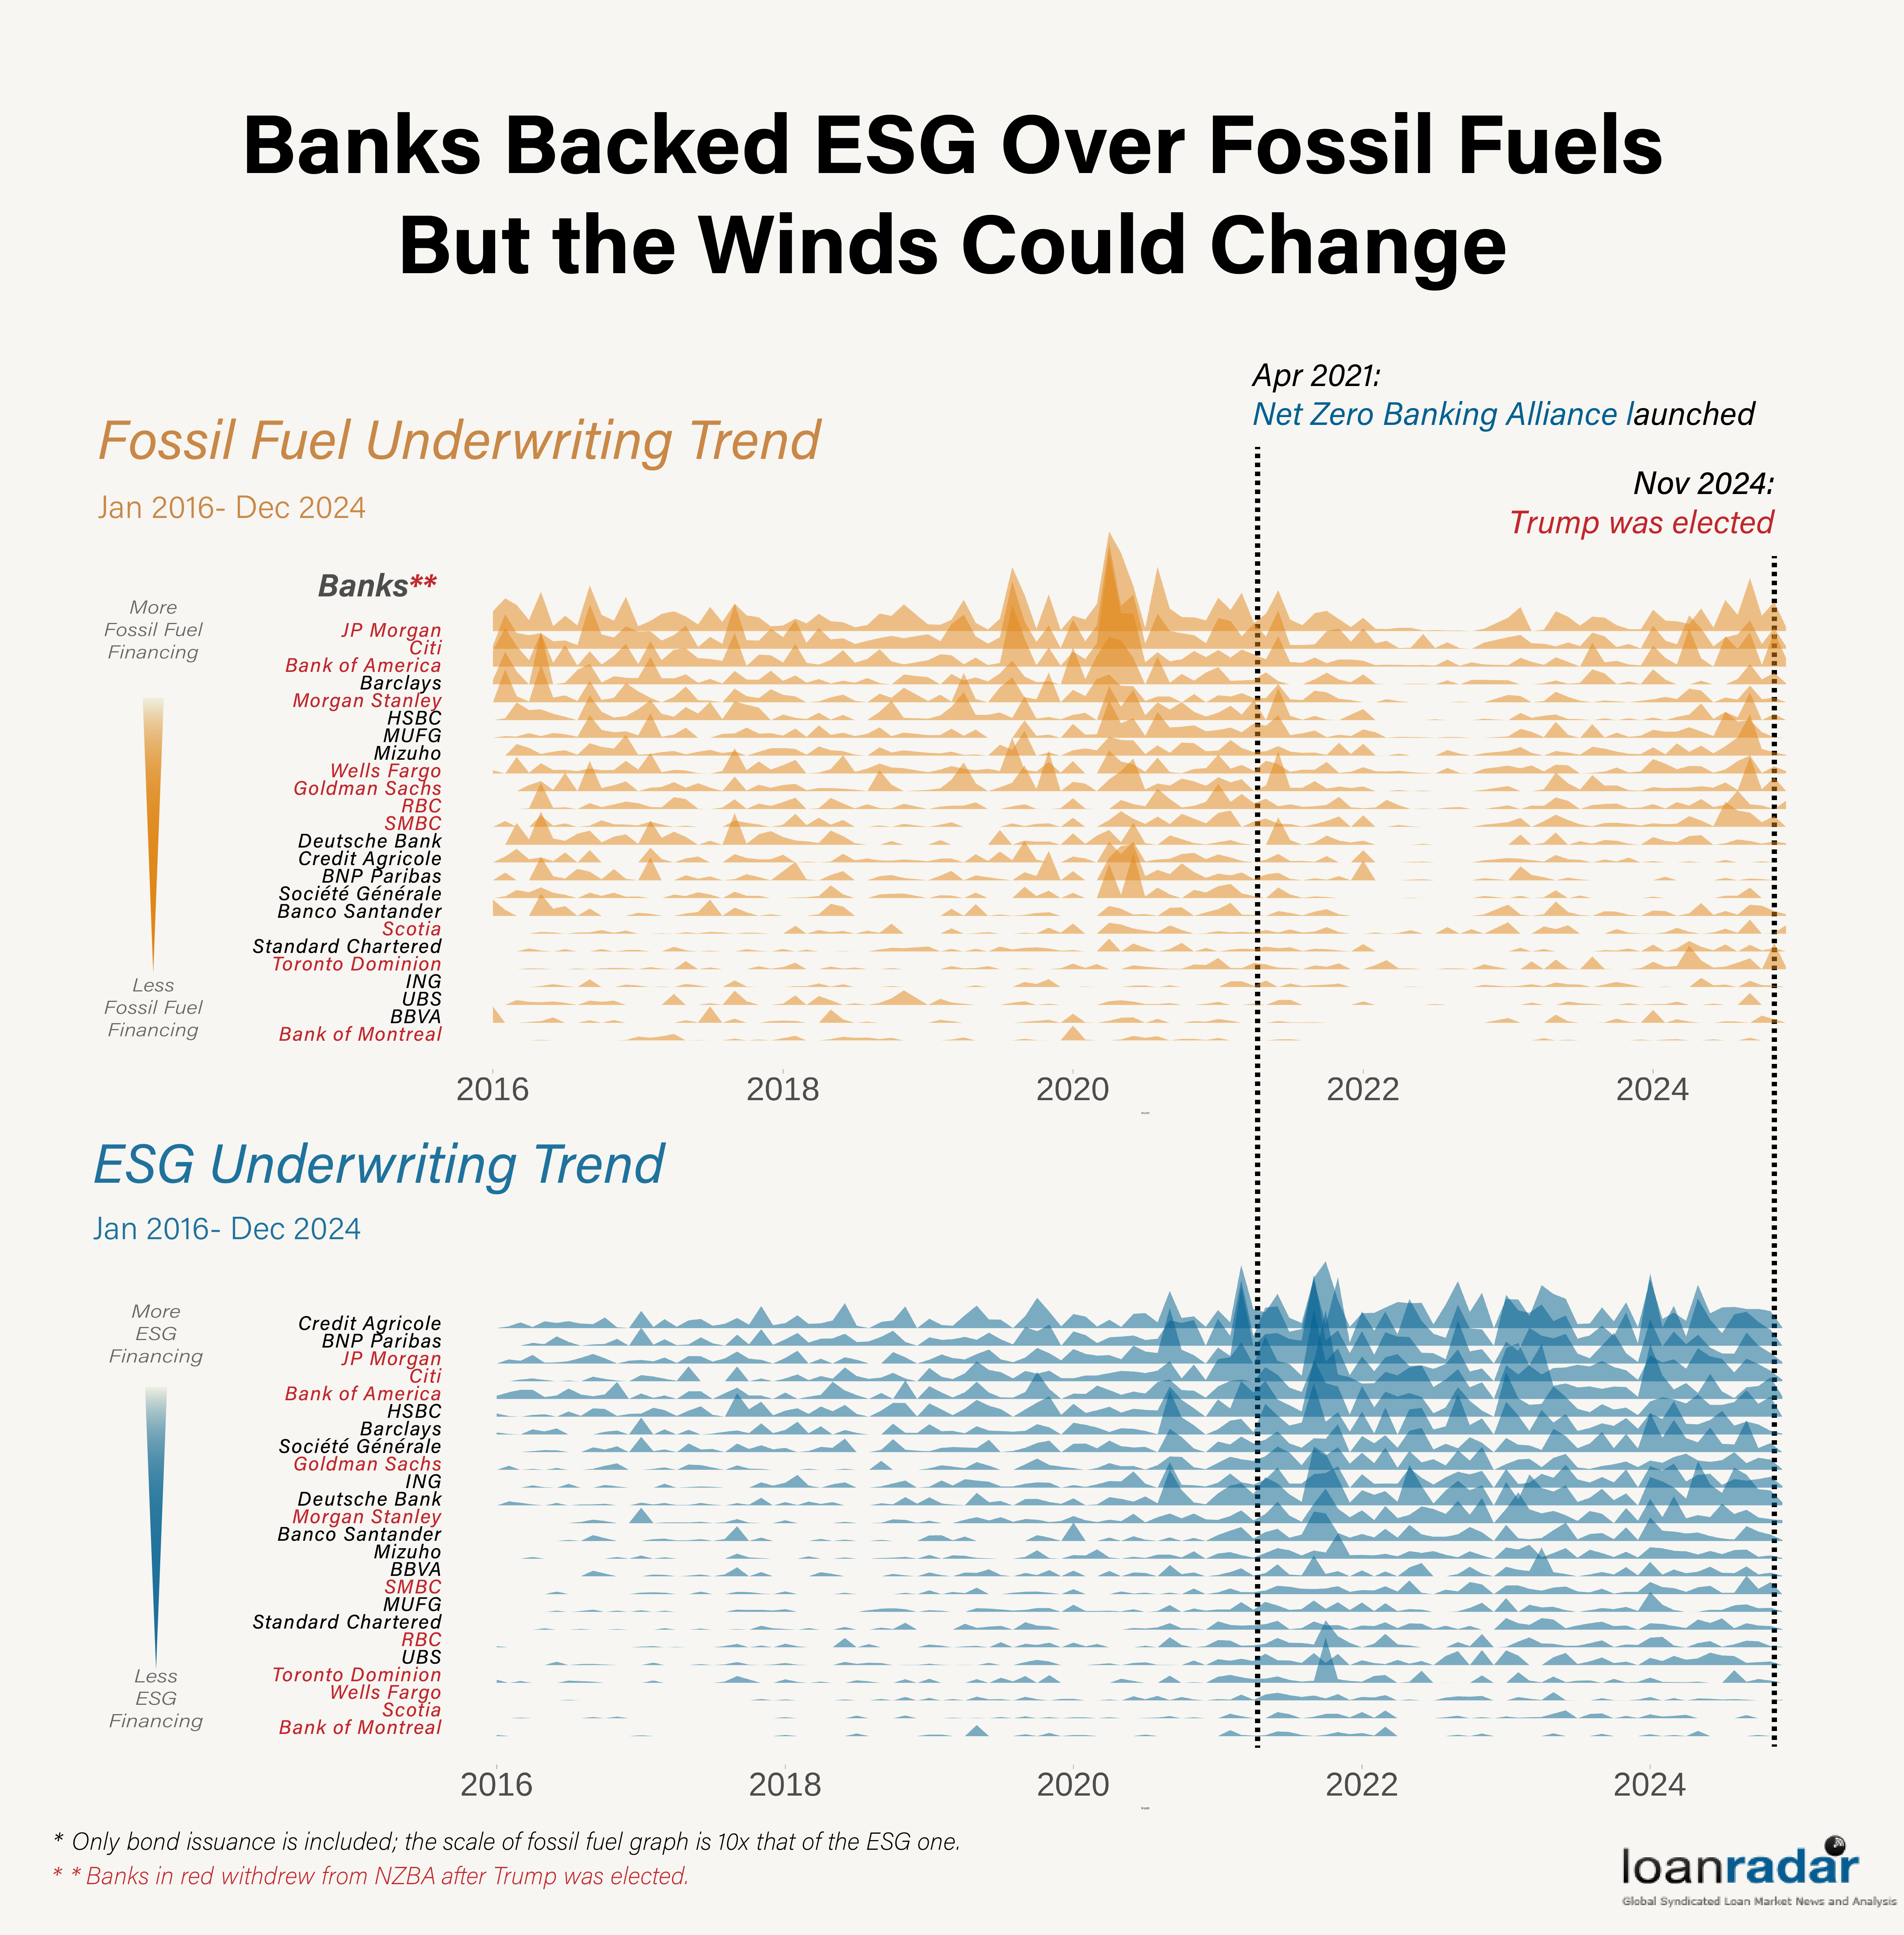
{Ridgeline}: R, Adobe Illustrator, API
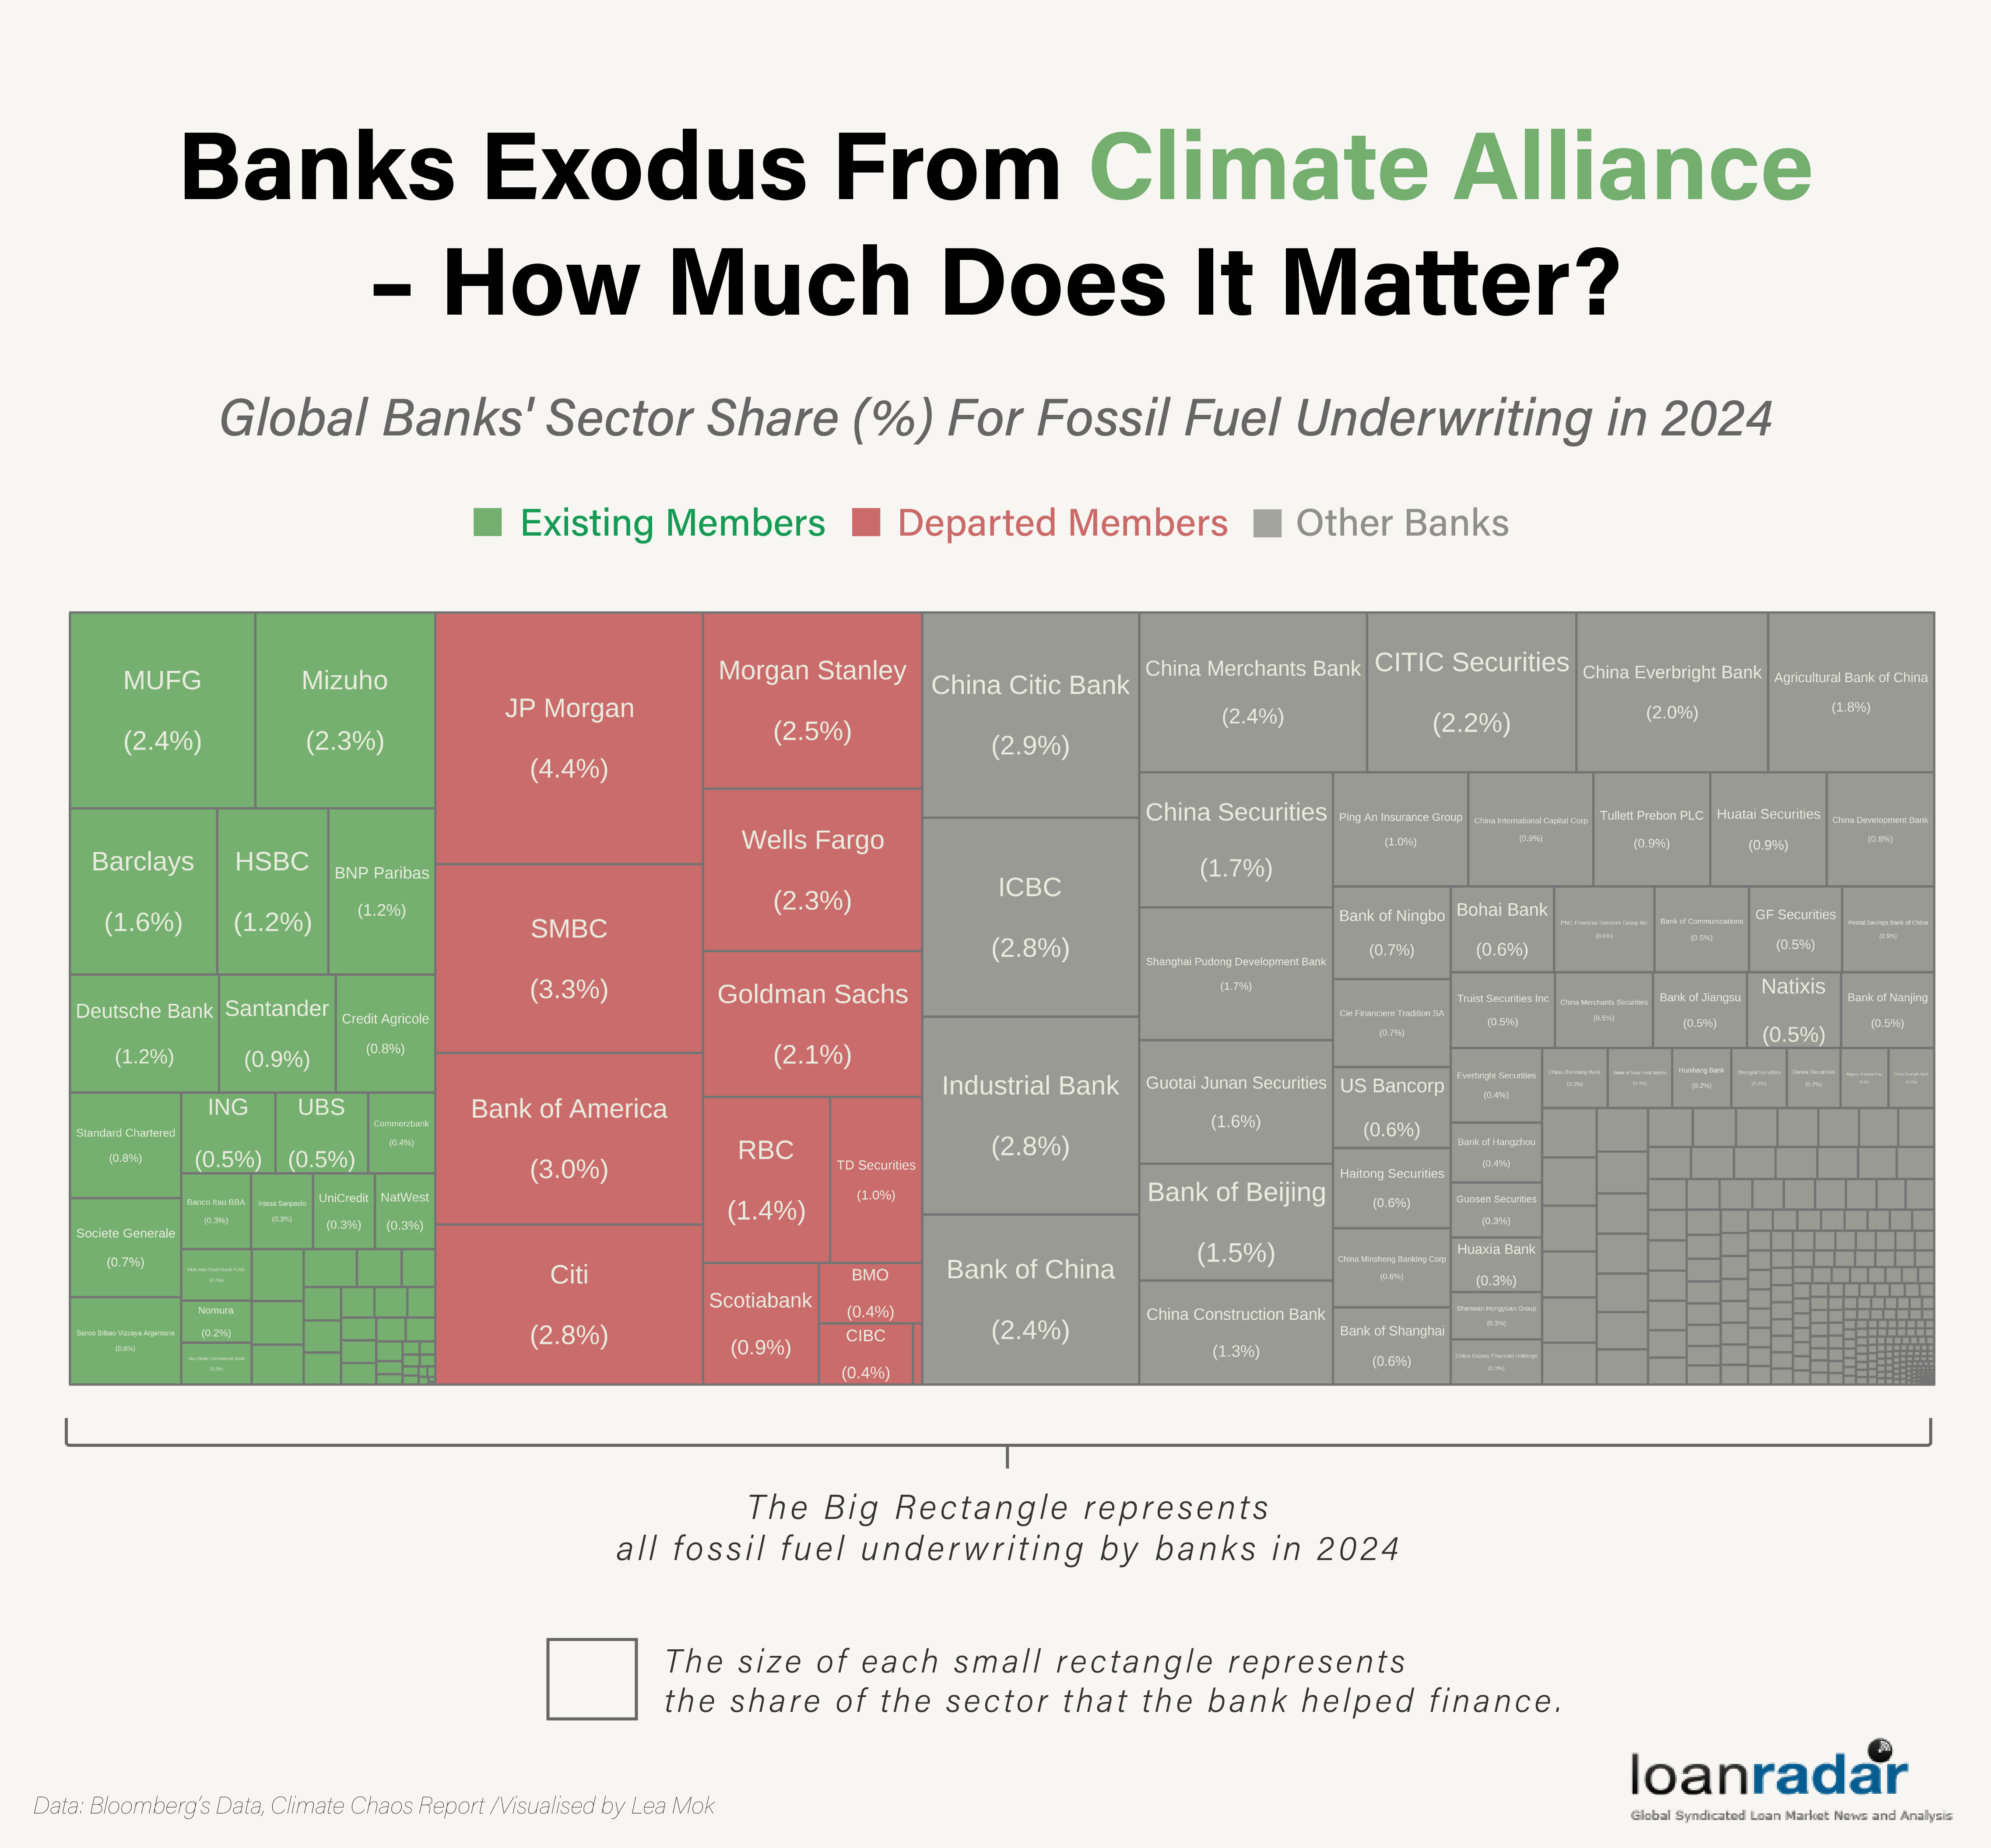
{Treemap}: R, Adobe Illustrator, Bloomberg Terminal
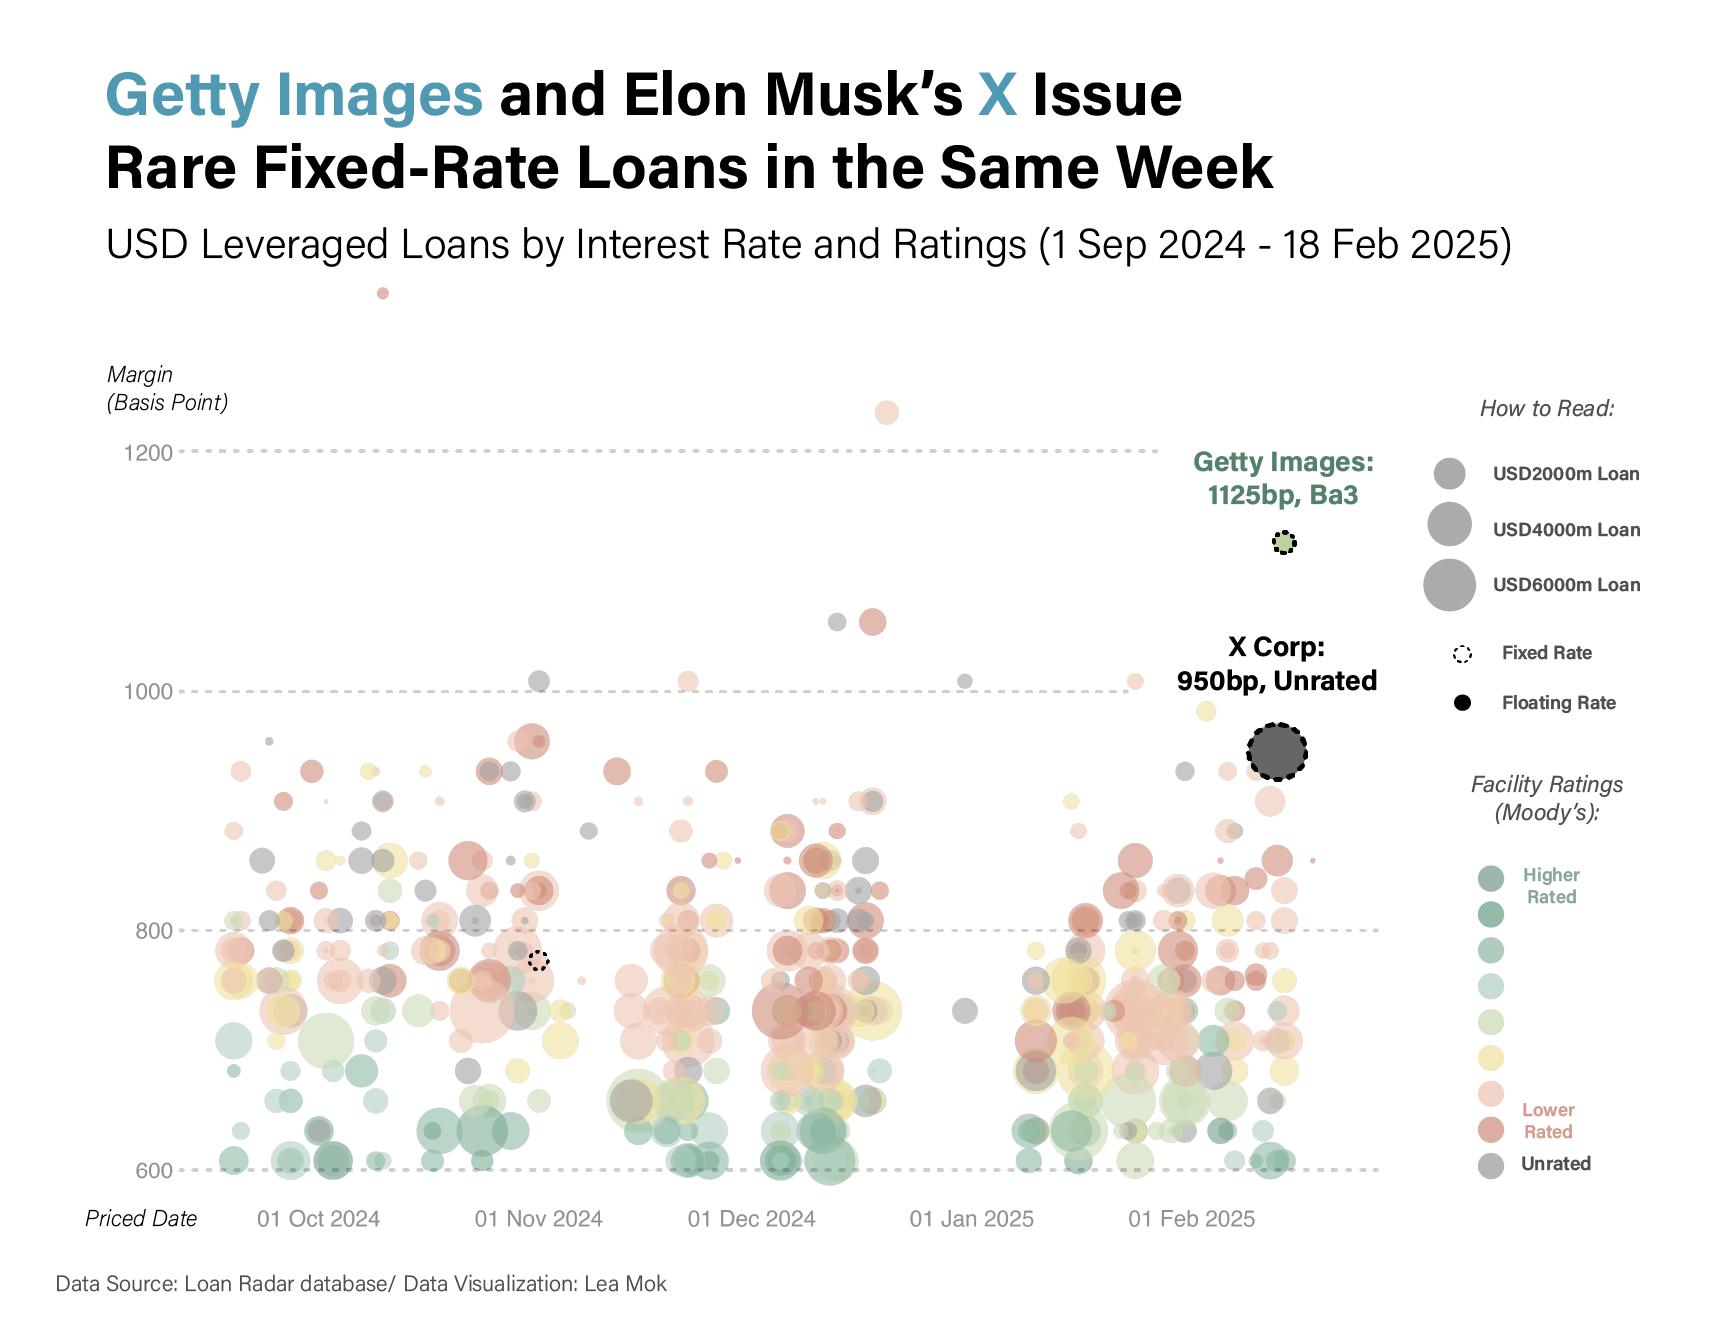
[Bubble Chart]: R, Adobe Illustrator, API
{Interactive Bubble Chart}: Rstudio, D3.js, API
[Ridgeline]: R, D3.js
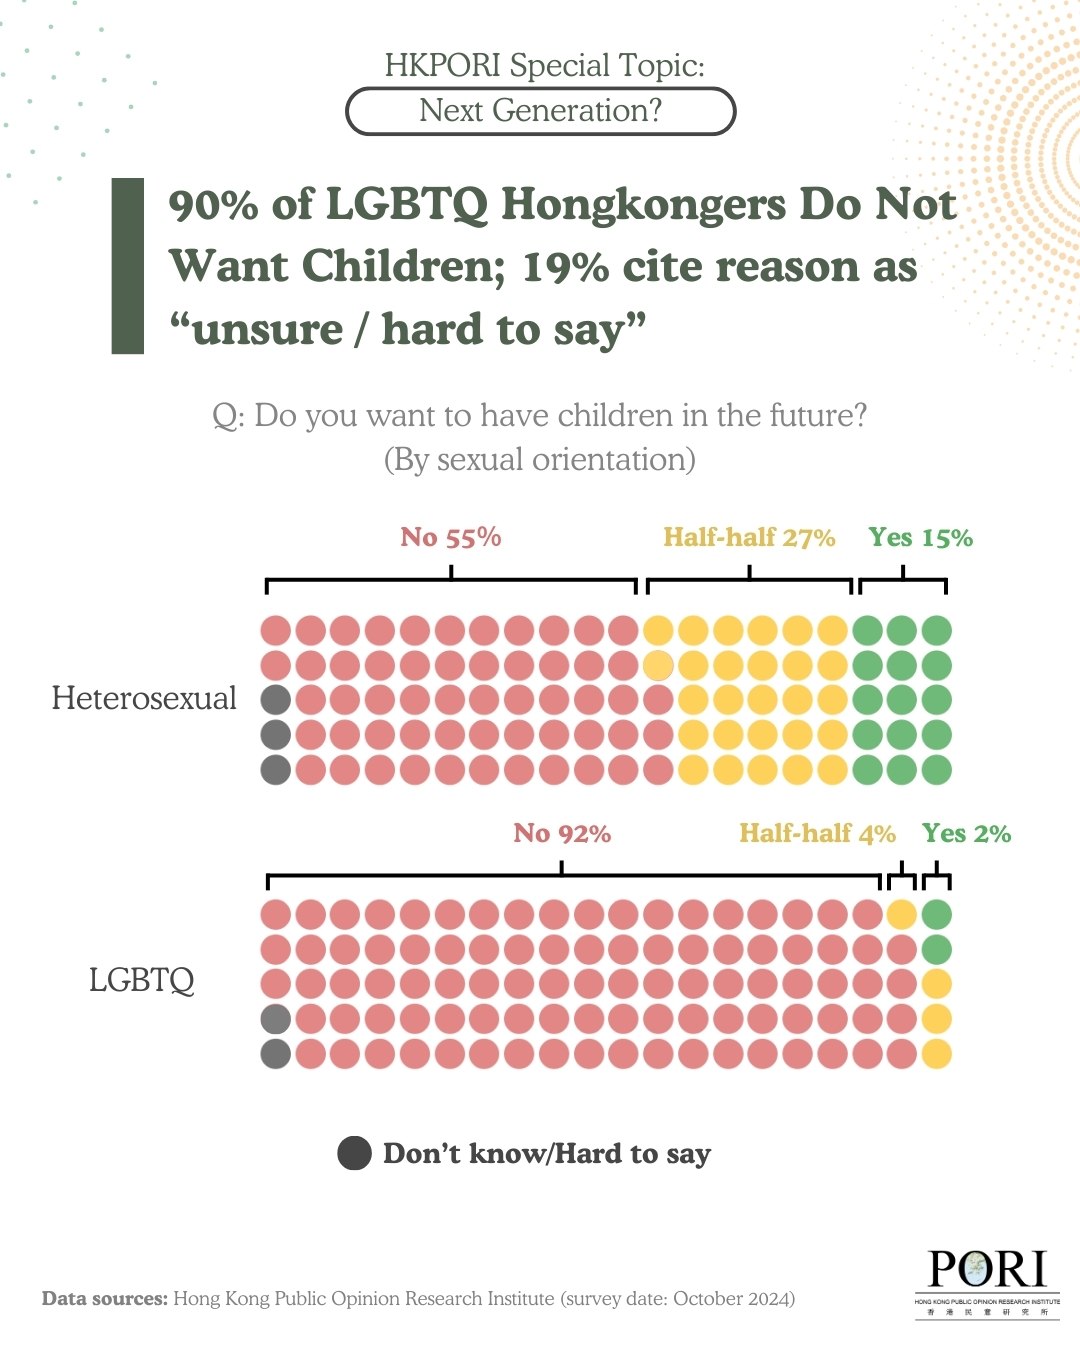
{Gallery}: flourish, Canva
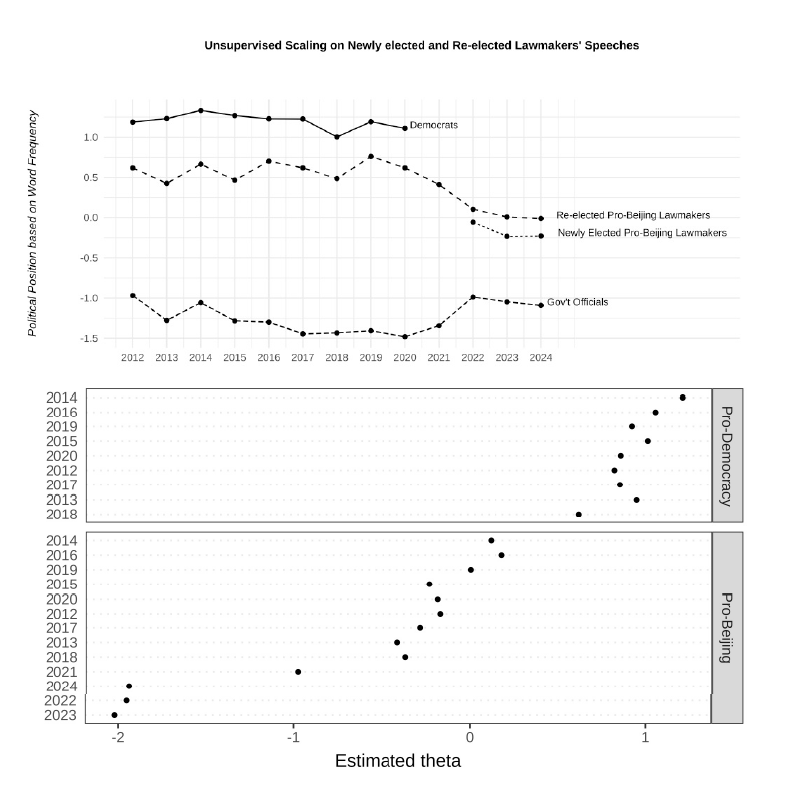
{Academic Graphs}: Rstudio, API
{Interactive Map}: Rstudio
{Interactive Heatmap}: Rstudio, API