⋱ ESG Is No Longer Cool For Big Banks
{Ridgeline}: R, Adobe Illustrator, API
The Story
Three years ago, 450 financial firms pledged USD 130 trillion to finance the net-zero transition. Now, they’re rushing in the opposite direction - pulling out of climate-related initiatives.
Within three months of Trump’s victory at the ballot box, 12 North American banks have withdrawn from the UN-sponsored Net Zero Banking Alliance (NZBA).
The impact of this exodus remains unclear, but the message is obvious - talking about the green transition is no longer in vogue. The ESG label, once a badge of corporate virtue, has now become a legal minefield.
░ The full story is available to subscribers of Bond Radar, a London-based financial news & data company - 28 Feb 2025
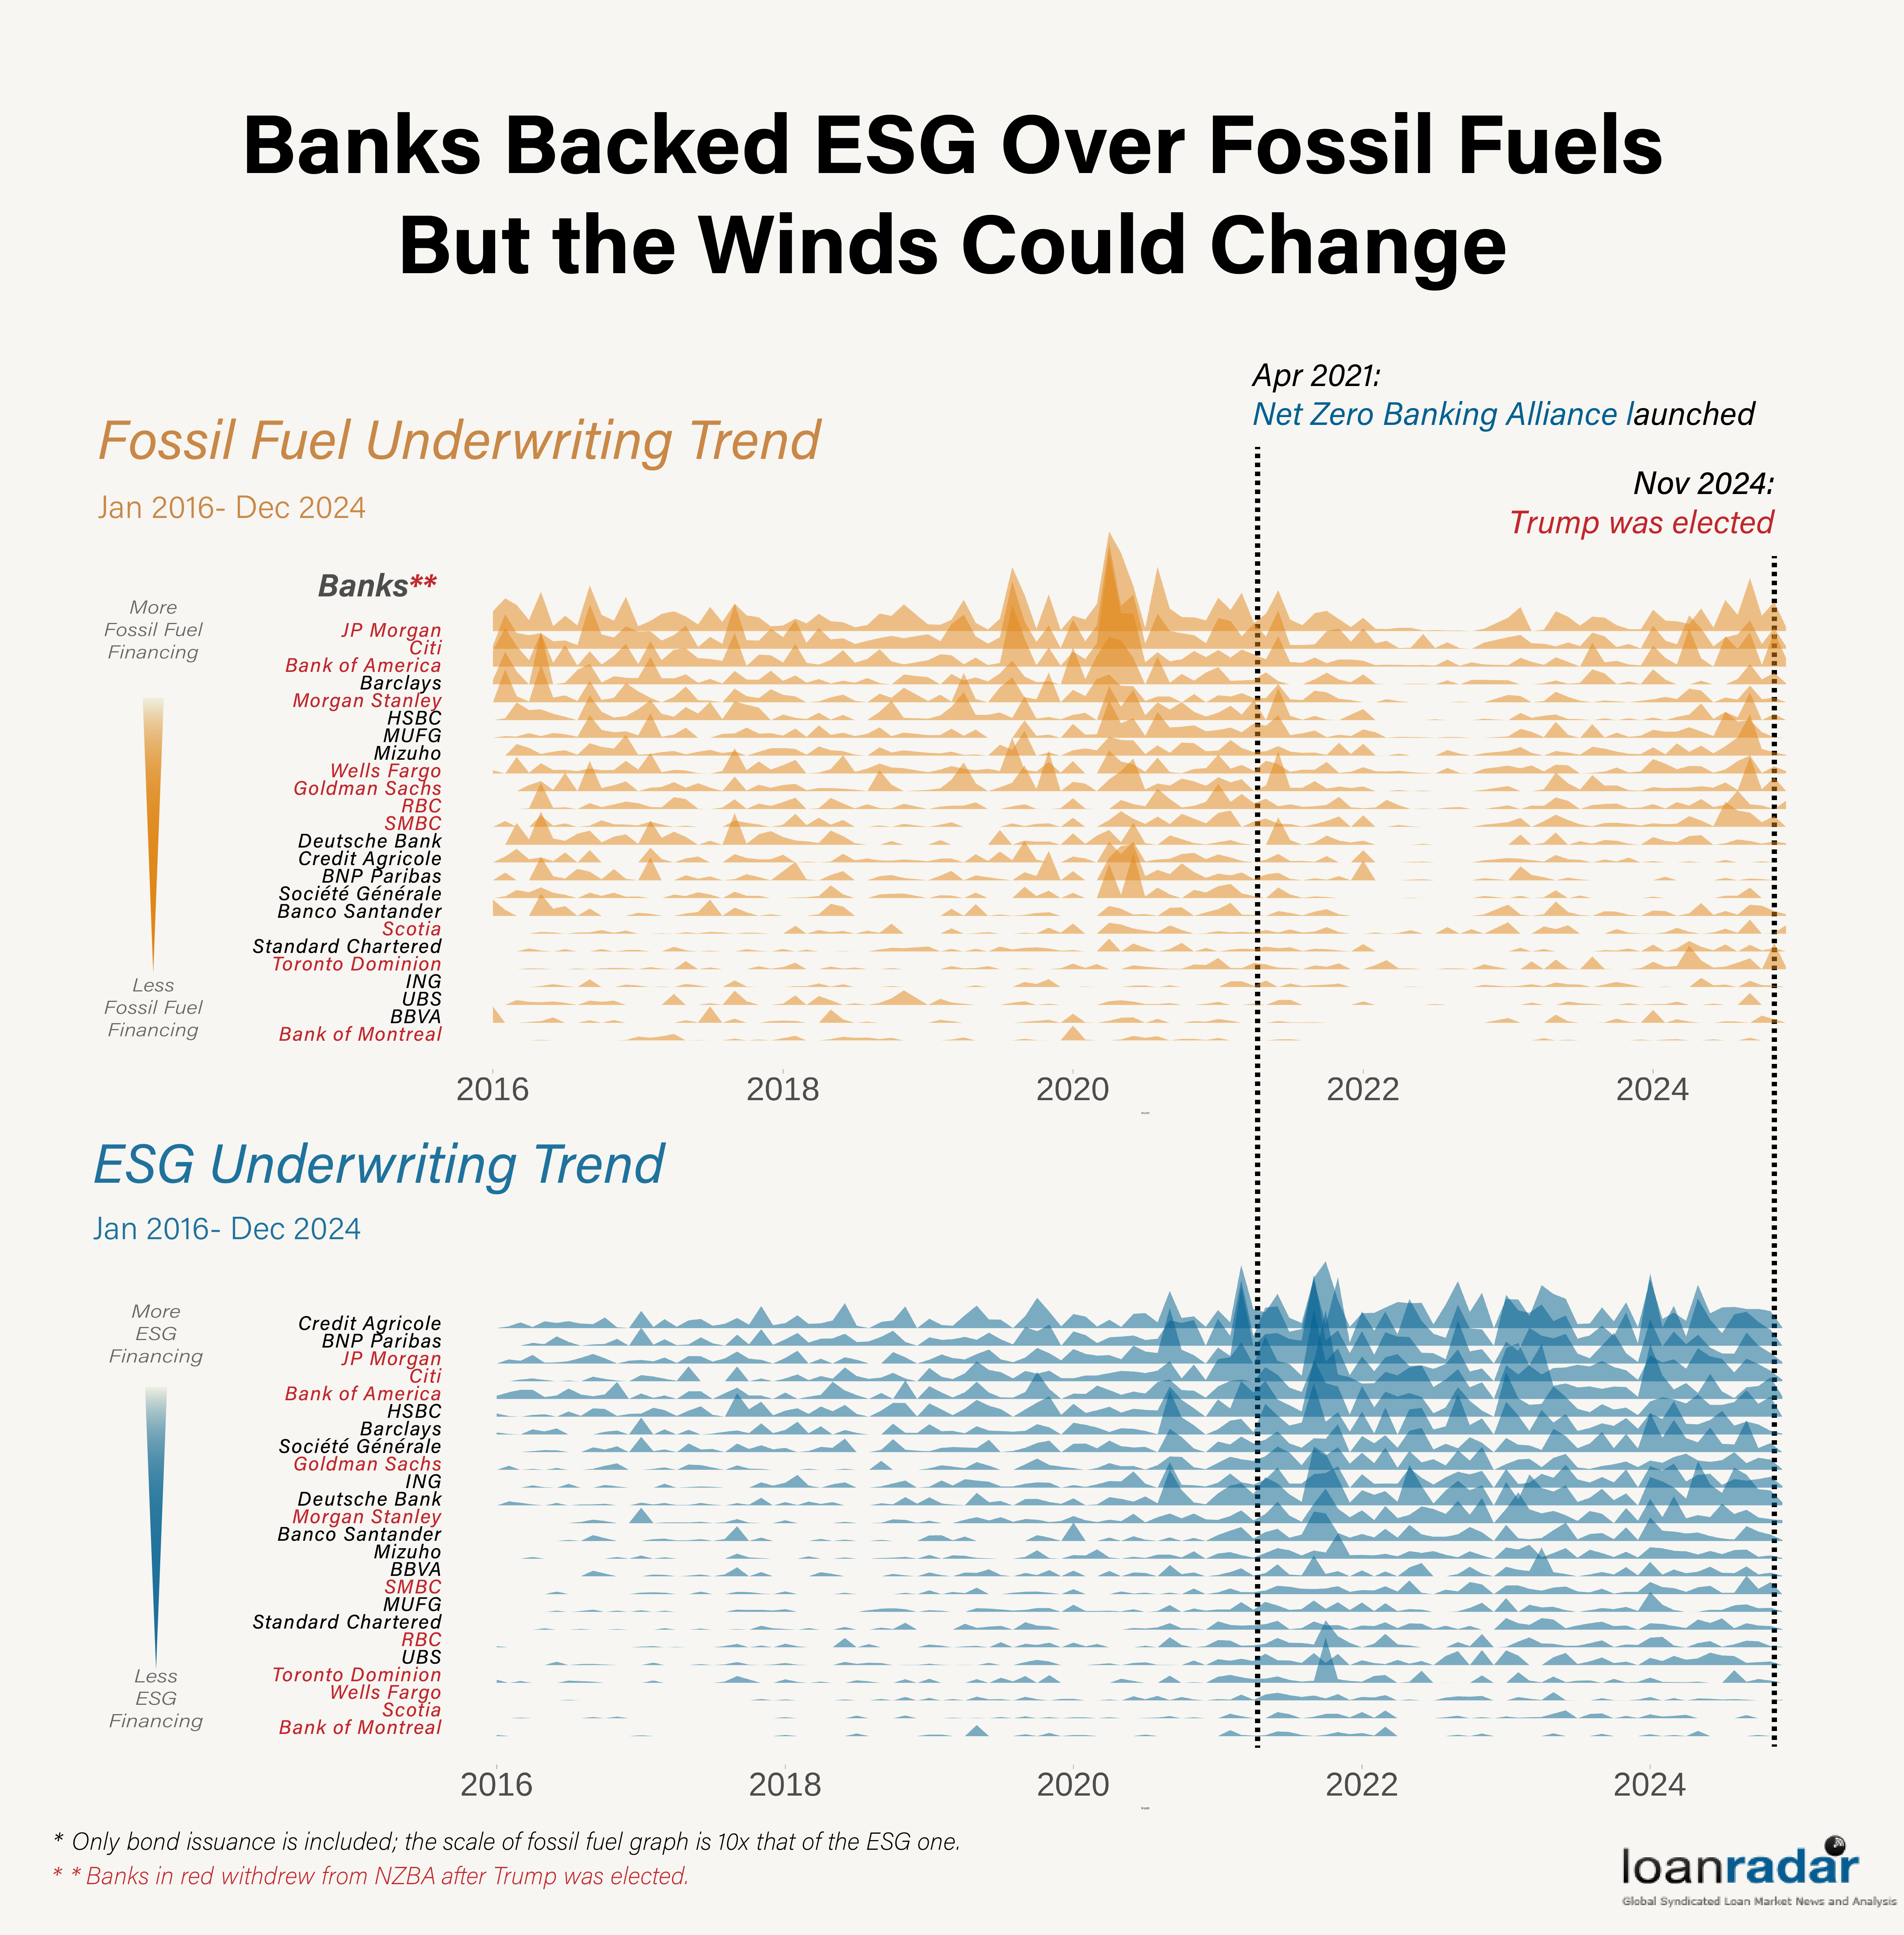
The Graph
This is a graph from the same story as this one here.
This is my first article published on Bond Radar’s platform. The exodus of Wall Street giants has been widely covered by major media outlets as well as the editorial and research branches of financial firms - most accompanied their articles with line graphs showing the departing U.S. banks’ fossil fuel financing over the years. (See the article and graphs) by one of our interviewees.
I wanted to take a different approach.
Research Question:
- Did banks actually reduce fossil fuel financing and underwriting after joining the climate alliance?
- Which banks have underwritten the most bonds in the fossil fuel sector and the most ESG-labelled bonds?
| Tools Used | Rstudio, Adobe Illustrator |
| Data Source | Bond Radar API |
Findings
The final graph shows a stark contrast between the trend in fossil fuel financing and that of ESG financing - but we’d be naive to believe that NZBA membership alone drove this shift.
When the alliance was formed in April 2021, then-U.S. President Joe Biden signed a series of executive orders to roll back Trump-era policies, pledging to halve the nation’s emissions by 2030.
As a result, dollar-denominated ESG issuance surged - even as the overall bond market, particularly in the fossil fuel sector, slowed dramatically due to rising Fed interest rates.
Another thing to note is that, although Wall Street banks have underwritten far more bonds than European banks, their ESG book lags behind that of their counterparts.
So, while this graph presents a key finding, it likely isn’t enough to provide a full explanation.
The Script
plot2 <- ggplot(esg_data, aes(Month,
  	y = fct_reorder(Lead, Value), height = Value)) +
  		geom_density_ridges(
    		stat = "identity", scale = 5,
			linewidth = 0, alpha = 0.5,
            fill = "#005F91", color = "transparent"
 ) +
  scale_x_date(
	limits = c(as.Date("2016-01-01"), as.Date("2024-01-01"))) +
  coord_cartesian(ylim = c(0, 30)) +
  labs(title = "Title", y = "Lead", x = "Month") +
  theme(
    plot.title = element_blank(),
    axis.ticks.y = element_blank(),
    axis.text.y = element_text(
		face="bold",family = "Bahnschrift", size = 80),
    axis.text.x = element_text(
		family = "Bahnschrift", size = 120),
    panel.grid.major.x = element_blank(),
    panel.grid.minor.x = element_blank(),
    panel.border = element_blank(),
    panel.background = element_rect(fill='transparent'),
    plot.background = element_rect(
		fill='transparent', color=NA),
    panel.grid.major = element_blank(),
    panel.grid.minor = element_blank(),
    legend.background = element_rect(fill='transparent'),
    legend.box.background = element_rect(fill='transparent')
  )