⋱ Wall Street Exodus From Climate Alliance
{Treemap}: R, Adobe Illustrator, Bloomberg Terminal
The Story
This is a graph from the same story as this one here.
Within three months of Trump’s victory at the ballot box, over a dozen investment banks have withdrawn from the UN-sponsored Net Zero Banking Alliance (NZBA).
░ The full story is available to subscribers of Bond Radar, a London-based financial news & data company - 28 Feb 2025
The Graph
Research questions:
- How important is the alliance? How can that be shown?
- Are the departing U.S. banks significantly larger than the remaining member banks?
| Tools Used | Rstudio, Adobe Illustrator, Bloomberg Terminal |
| Data Source | Bloomberg |
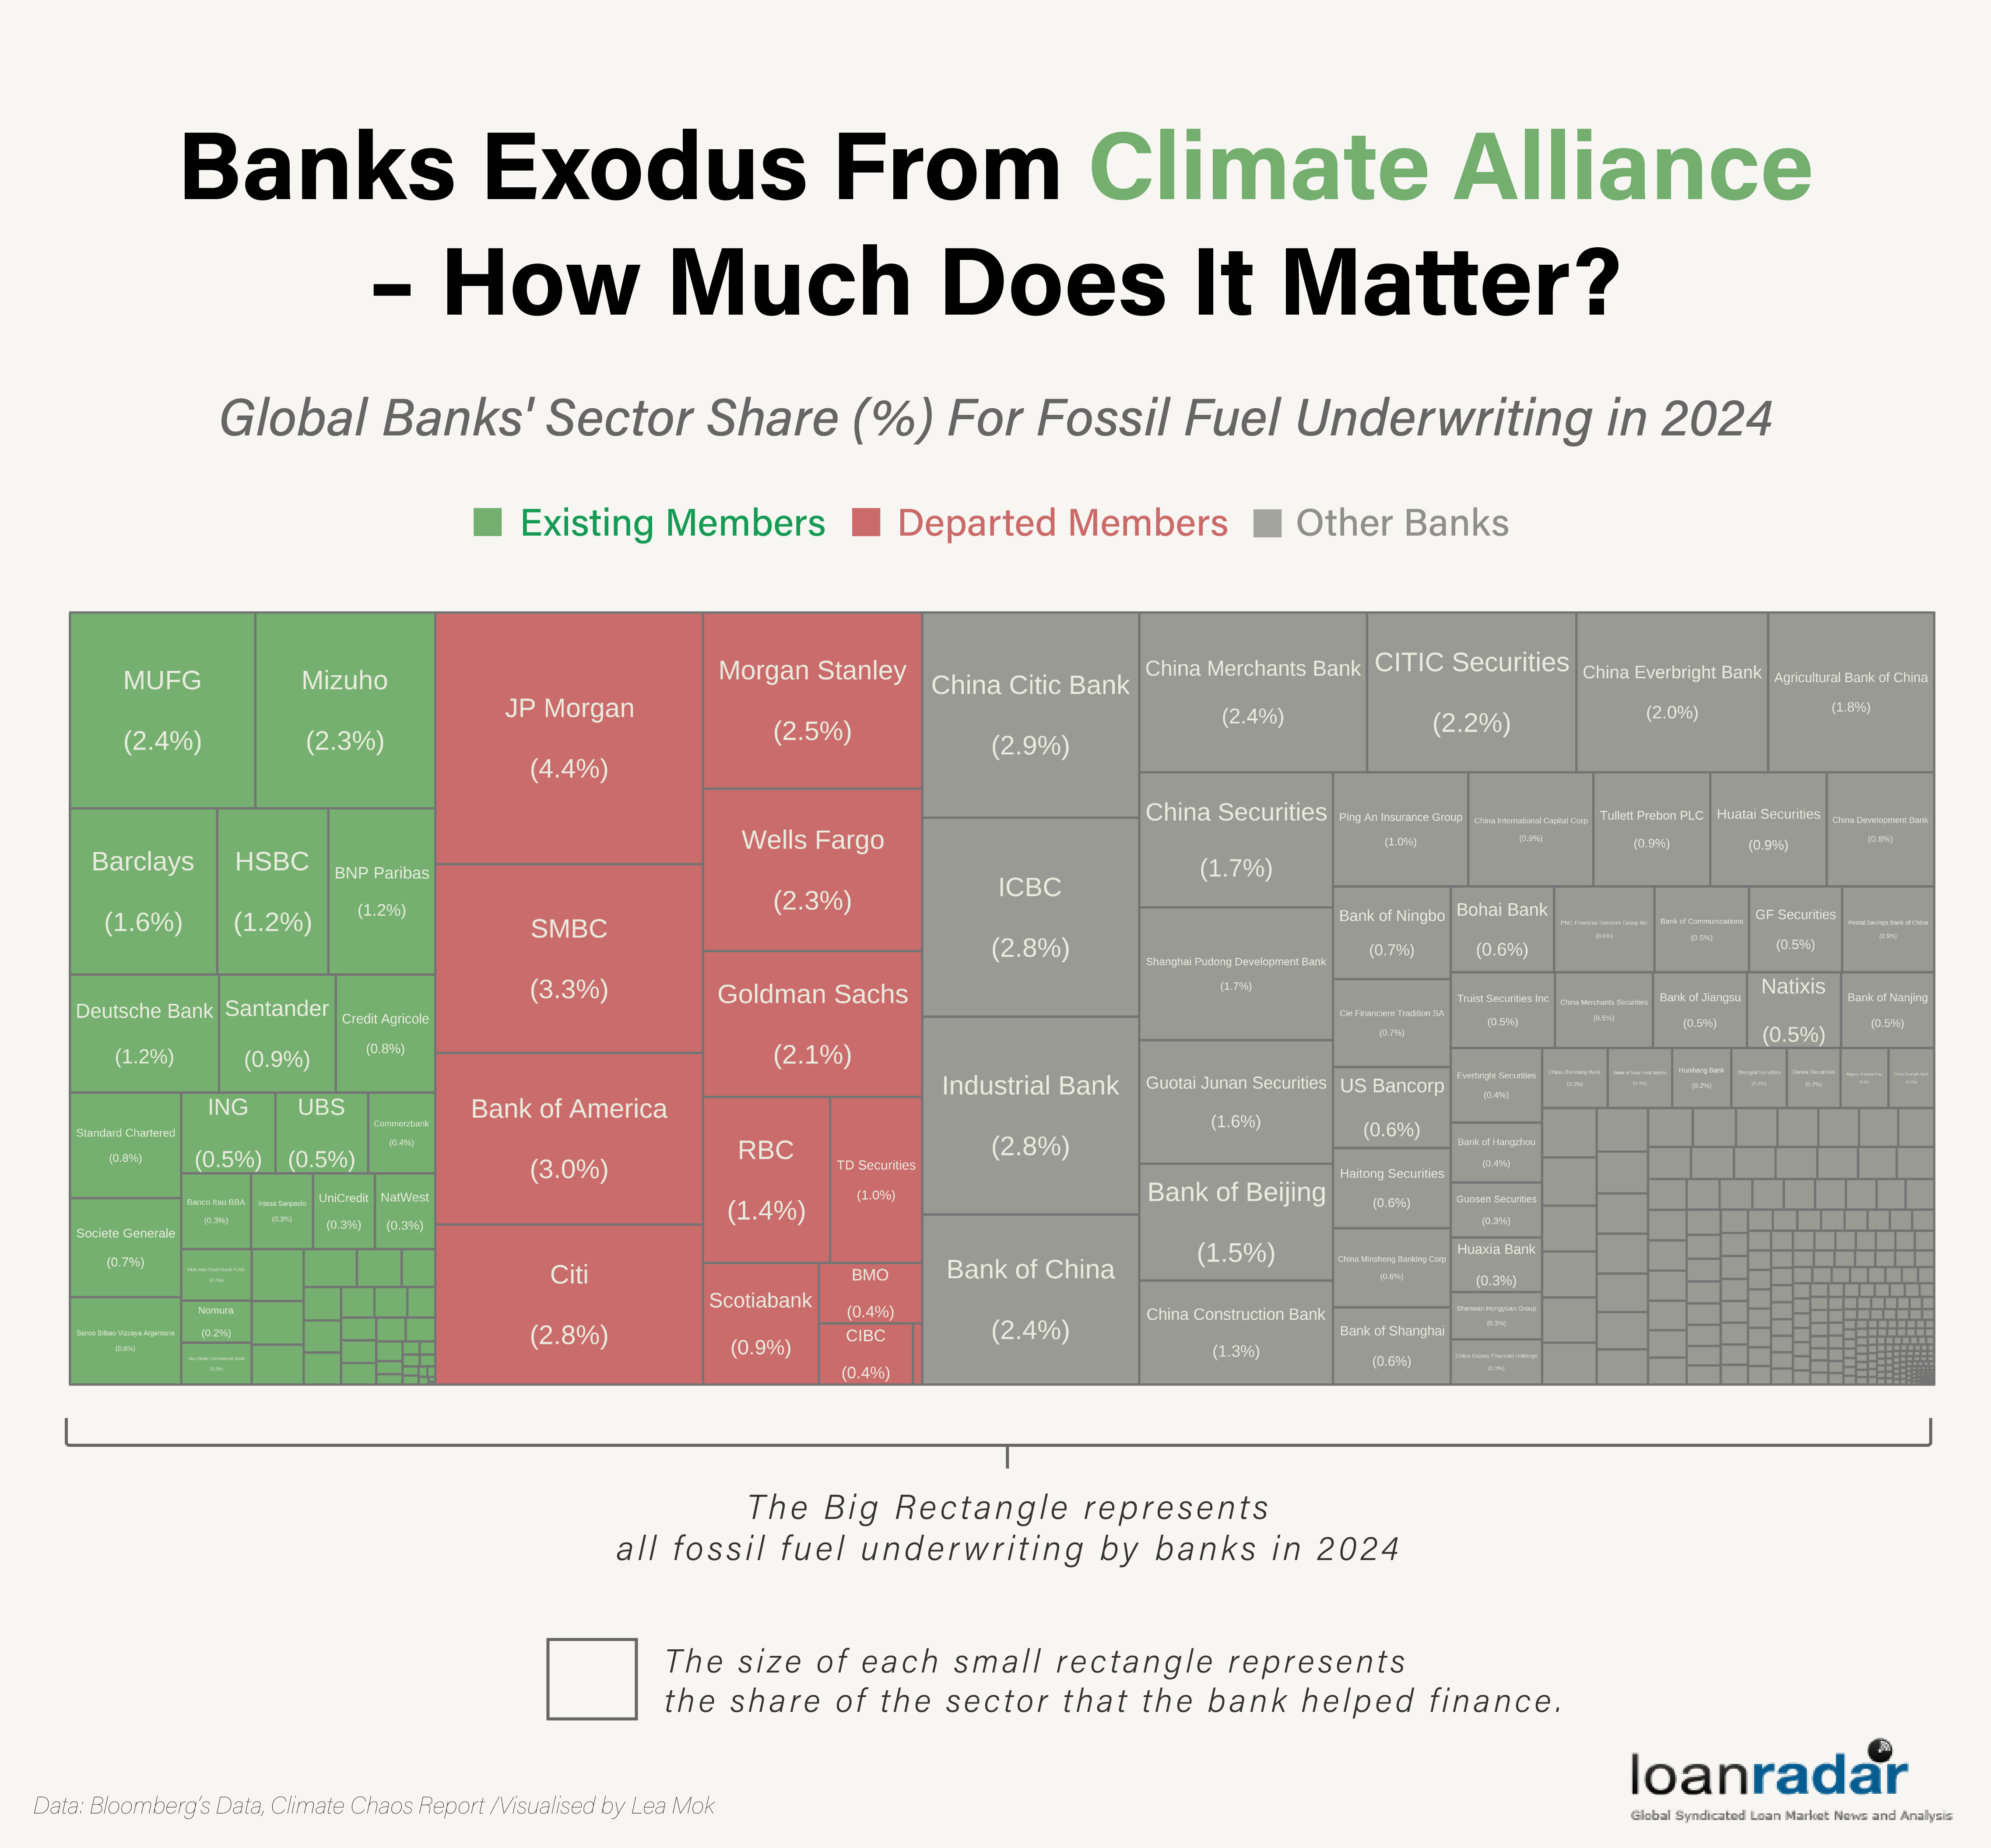
Using the list of fossil fuel companies from the Banking on Climate Chaos Report 2024, I downloaded the league table for fossil fuel financing and underwriting with SCRH{GO} & W{GO}, then calculated the sector shares of the remaining NZBA members versus the departing banks.
Findings
According to the final graph, the departing financial firms accounted for over one-fifth of global fossil fuel bond financing in 2024. The remaining NZBA members - mostly European and Japanese banks - made up another fifth of the total.
As it turns out, although only 12 of the original 147 members have left, the alliance’s presence in the sector has effectively been cut in half.
The Script
# This is a R script for the plot
# The data cleaning part is not shown

ggplot(data_ggplot) +
  	geom_rect(aes(xmin = x0,
                ymin = y0,
                xmax = xmax,
                ymax= ymax,
                fill = vColor),
            size = 0.5,
            colour = "#666666",
            alpha = 1) +
  	geom_fit_text(data = data_ggplot %>% filter(rank <= 80),
               aes(xmin = x0,
                   xmax = xmax,
                   ymin = y0,
                   ymax = ymax,
                   label = manager),
               colour = "#E8EADC",
               family = "Bahnschrift",
               size = 30 * ggplot2::.pt,
               lineheight = 0.3,
               min.size = 4,
               reflow = FALSE) +
	#Bond Radar's color scheme
  	scale_fill_manual(values = c("#005F91", "#E2871A", "#8f9089")) +
  	theme_void() +
  	theme(text = element_text(colour ="#1E1D23"),
        legend.position = "top",
        legend.box = "horizontal",
        panel.border = element_blank(),
		# I made it transparent
		# so it's easier to edit in Adobe
		panel.background = element_rect(fill='transparent'),
		plot.background = element_rect(fill='transparent',
										color=NA),
		#remove all of the gridlines
    	panel.grid.major = element_blank(),
    	panel.grid.minor = element_blank(),
    	legend.background = element_rect(fill='transparent'),
    	legend.box.background = element_rect(fill='transparent')
        )